Announcement

Collapse
No announcement yet.

Global Warming...Fact or Fiction?

Collapse
X
 
  • Filter
  • Time
  • Show
Clear All
new posts

  • Originally posted by Wooglin View Post
    If medicine was like climate science it would be more like this.... 10 MD's tell you they are 90% certain you have cancer because their computer model couldn't find any other explanation for your symptoms. All of them could not find any trace of cancer via x-ray or any other method of examination, and the 1 who actually suggests maybe the model is wrong and that you shouldn't begin chemo treatment is labeled a denier and subjected to personal attacks.

    It'll only be a couple hundred thousand, to be paid by you, by the time treatment is done.

    So do you begin chemo? Do you believe all observations or the model?

    You think I'm full of it with this comparison? Again, find me ANY observation that matches, or is even close to, panel F in the link above.
    Ahhhh...yes, I had totally forgotten about "the model."

    It's impossible to get this "average global temperature" (I don't even know what it means) that these guys have to create a computer program that will spit out the desired result.

    This model can only predict "the future." It was never able to predict the present or predict the past, as in plug in historical data to confirm if the model could generate a result that matches the observed climate. It couldn't.

    I would totally trust a bunch of government doctors telling me that I have cancer because they plugged my social security number and the food I like to eat into this computer model, without actually looking at me.
    "Only Nixon can go to China." -- Old Vulcan proverb.

    Comment


    • Originally posted by gunnut View Post
      ...It was never able to predict the present or predict the past, as in plug in historical data to confirm if the model could generate a result that matches the observed climate. It couldn't.
      They do what they refer to as "normalizing" the model.

      The models consistently fail to yield predictions within the range of error, and they know this. So they take the current data and plug it in, then run the models backwards.

      The result is inconsistent with historical data, and they adjust the algorithms to try to bring in the historical numbers, while holding true to their basic assumptions wrt CO2 effects.

      Then they run the model forward, and this becomes the "new" prediction. Next year they repeat the process.
      "We will go through our federal budget – page by page, line by line – eliminating those programs we don’t need, and insisting that those we do operate in a sensible cost-effective way." -President Barack Obama 11/25/2008

      Comment


      • Originally posted by highsea View Post
        They do what they refer to as "normalizing" the model.

        The models consistently fail to yield predictions within the range of error, and they know this. So they take the current data and plug it in, then run the models backwards.

        The result is inconsistent with historical data, and they adjust the algorithms to try to bring in the historical numbers, while holding true to their basic assumptions wrt CO2 effects.

        Then they run the model forward, and this becomes the "new" prediction. Next year they repeat the process.
        What's more, once you've dialed in the historical trend match, you remove the co2/WV feedback assumption driving the model and of course the simulated trend changes and it no longer matches the observed trend. Then you can say we can't account for all of the observed trend w/o co2/WV feedback, so our model is evidence the hypothesis is correct. (Doh!)

        Comment


        • In any other line of work, this is called FRAUD!!! With the exception of government accounting, of course. ;)
          "Only Nixon can go to China." -- Old Vulcan proverb.

          Comment


          • ^^^ Lol. The models were wrong, which proves we were right. Lovely.

            I've been looking into CO2 fertilization. It's pretty funny- all of the IPCC predictions are turning out to be exactly backwards. Canadian treelines are moving south instead of north, California mountain vegetation is moving downslope instead of upslope, tropical rainforests are expanding instead of contracting, the thawing of tundra results in increased growth of deciduous shrubs, which shades the tundra from further thawing, etc.

            Every prediction of disaster, someone looks closer and finds a negative feedback loop. Imagine that- the planet adapts.

            I am beginning to think the environmentalists secretly hate trees....
            "We will go through our federal budget – page by page, line by line – eliminating those programs we don’t need, and insisting that those we do operate in a sensible cost-effective way." -President Barack Obama 11/25/2008

            Comment


            • Originally posted by gunnut View Post
              In any other line of work, this is called FRAUD!!! With the exception of government accounting, of course. ;)
              Not a word I like to throw around lightly... however, the same models also tell them the distinct pattern we should be seeing from GHG induced warming. Specifically, if the co2/WV feedback hypothesis is correct and was in fact the major factor of warming for the last 50 years then, as all IPCC models project, we should see tropospheric warming which exceeds that of the surface (this is the big old red hotspot in Panel C and F Figure 9.1 - AR4 WGI Chapter 9: Understanding and Attributing Climate Change), primarily due to water vapor feedback. Problem is, neither satellite or radiosondes have ever found it. It's not there. In fact, all satellite and radiosonde datasets tell us the surface has actually warmed faster than the troposphere. So WTF?

              Satellite temperature measurements - Wikipedia, the free encyclopedia

              The IPCC knew this. It's not even disputed. Yet, despite this fundamental gaping hole, they still made statements regarding attribution with high certainty. That takes a healthy dose of willful ignorance, at the very least.

              Comment


              • Wooglin
                Not a word I like to throw around lightly... however, the same models also tell them the distinct pattern we should be seeing from GHG induced warming. Specifically, if the co2/WV feedback hypothesis is correct and was in fact the major factor of warming for the last 50 years then, as all IPCC models project, we should see tropospheric warming which exceeds that of the surface (this is the big old red hotspot in Panel C and F Figure 9.1 - AR4 WGI Chapter 9: Understanding and Attributing Climate Change), primarily due to water vapor feedback. Problem is, neither satellite or radiosondes have ever found it. It's not there. In fact, all satellite and radiosonde datasets tell us the surface has actually warmed faster than the troposphere. So WTF?
                there is a recent paper from November which may be influential on this specific issue

                Extra satellite records settle tropospheric warming row « Simple Climate

                the actual scientific paper
                Tropospheric temperature trends: history of an ongoing controversy - Thorne - 2010 - Wiley Interdisciplinary Reviews: Climate Change - Wiley Online Library

                from the abstract
                It is concluded that there is no reasonable evidence of a fundamental disagreement between tropospheric temperature trends from models and observations when uncertainties in both are treated comprehensively
                from the conclusion
                The state of the observational and model science has progressed considerably since 1990. The uncertainty of both models and observations is currently wide enough, and the agreement in trends close enough, to support a finding of no fundamental discrepancy between the observations and model estimates throughout the tropospheric column. However, the controversy will undoubtedly continue because some estimates of tropospheric warming since 1979 are less than estimates of surface warming, or fall outside of the range of analogous model estimates
                What do you think?
                Last edited by tantalus; 18 Feb 11,, 21:01.

                Comment


                • Originally posted by tantalus View Post
                  Wooglin

                  there is a recent paper from November which may be influential on this specific issue

                  Extra satellite records settle tropospheric warming row « Simple Climate

                  the actual scientific paper
                  Tropospheric temperature trends: history of an ongoing controversy - Thorne - 2010 - Wiley Interdisciplinary Reviews: Climate Change - Wiley Online Library

                  from the abstract


                  from the conclusion


                  What do you think?
                  Well, the article never addressed the actual issue. They say it was "resolved' but they never said what was resolved, or what the answer was. They seem to be attacking a strawman instead.

                  They keep referring to a Christy/Spencer 1990 paper, which I guess they are implying was the issue, but it's not at all. That long ago settled issue was regarding the sign of the trend, not the amplification we should be seeing. We all know the tropos trend is positive, but that's not the question and hasn't been for about 2 decades.

                  As for the paper, it is equally obscure. They say it's resolved but they do not show that it is resolved. they spend the majority of the paper talking about the history of satellites and radiosondes, show graphs that do not show how the expected warming exists, then simply state the issue is resolved w/o having discussed the issue of amplification or showing how it is actually resolved.

                  They say the trend is "close enough" that there is no discrepancy now but I do not see that. I don't see where they show the tropos warming 1.3x to 1.4x surface warming all of a sudden. I don't see where the tropos trend went from being lower than the surface trend to higher than the surface trend. I don't even see the majority of observations they used within the error range of the model estimates. How did they resolve it and what exactly did they resolve? Can you point it out?


                  To see what the actual, non-obscured, issue is read this:

                  Christy, Pielke, Douglass, Spencer, et al: 2010

                  What Do Observational Datasets Say about Modeled Tropospheric Temperature Trends since 1979

                  http://www.mdpi.com/2072-4292/2/9/2148/pdf

                  After reading that, go back and read the paper you cited and see f it makes any sense to you. Tell me if you see a resolution there.

                  Also, from the paper you cited:

                  Since the earliest attempts to mathematically model the climate system's response to human-induced increases in greenhouse gases,1 a consistent picture of resulting atmospheric temperature trends has emerged. The surface and troposphere (the lowest 8–12 km) warm with a local maximum trend in the upper levels in the tropics, while the stratosphere above cools (Figure 1).
                  This is another related issue...the stratosphere. It should cool as a result of tropospheric warming, another signature of GHG warming. It has in fact been warming for the last 15-25 years (see papers below). If the tropos IS warming at such a rate (w/o us being able to detect it) then why the hell is the stratosphere warming too?

                  Ozone and Temperature Trends in the Upper Stratosphere at Five Stations of the Network for the Detection of Atmospheric Composition Change

                  Understanding Recent Stratospheric Climate Change

                  An update of observed stratospheric temperature trends

                  Recent Stratospheric Temperature Observed from Satellite Measurements
                  Last edited by Wooglin; 18 Feb 11,, 23:08.

                  Comment


                  • Wooglin,
                    I have been very busy, hence the very long delay on this reply, apologies…

                    I posted the paper (Thorne et al., 2010) as I could see that you have a key interest in this area, the paper I posted is the 1st review on this controversy I believe, it looked at 195 papers. I felt it would be of interest to you as a result. Its important for me to point out that it is very difficult for me to provide analysis on this, as simply I m not really capable as of yet, I must do a lot more research and still I would be in over my head…


                    Forget the article, I put it up to illustrate how I became alerted to the paper, there was no point in posting it. that was a mistake

                    On the issue, the paper you posted(Christy et al., 2010)
                    There have been essentially two groups of publications on this contentious issue, one reporting that trends of TLT in observations and models are statistically not inconsistent with each other (e.g., [4,5]) and the other reporting that model representations are significantly different than observations, thus pointing to the potential for fundamental problems with models
                    As your paper illustrates a debate exists in the literature.

                    Its seems to be its about the quality of the measurements, they simply are struggling to detect patterns, as in if the temp change really exists, it may still go undetected or due to difficulties encountered, the level of uncertainty can result in a produced trend far from the real one. If we understand the levels of uncertaintly in the real observations, we are in a better position to say that the real observations may not always be predicting as the models state but the margin of error is such that what is really happening may fit the models predictions, in a sense that past data collected in the field may not be reliable. Potentially????

                    Consider below and subsequent references (Thore et al., 2010), truthfully I have not verified them myself
                    Multiple lines of evidence suggest that many radiosonde datasets suffer from a bias toward excessive stratospheric cooling and insufficient tropospheric warming59,114,120,165,166,169 and that this bias is largest in the tropics,119,123 where the separation between the models and some of the radiosonde observations was largest.
                    However this is not my position, frankly I don’t have one as such, as it’s over my head. It does however fit one opinion I have on the matter, in that both the real observations and the models are inadequate in measuring (and certainly predicting) reality, and I expect the models are by far the guiltier of the two.

                    As stated in the paper (Thorne et al., 2010)
                    A full measure of both observational uncertainty and model uncertainty must be taken into consideration when assessing whether there is agreement or disagreement between theory (as represented by models) and reality (as represented by observations).
                    Again, it is hard for me to engage on the topic, mainly I was interested in hearing your thoughts on it, cheers.
                    Last edited by tantalus; 23 Mar 11,, 00:50.

                    Comment


                    • I posted the paper (Thorne et al., 2010) as I could see that you have a key interest in this area, the paper I posted is the 1st review on this controversy I believe, it looked at 195 papers. I felt it would be of interest to you as a result. Its important for me to point out that it is very difficult for me to provide analysis on this, as simply I m not really capable as of yet, I must do a lot more research and still I would be in over my head…
                      It's not the first review of the issue.

                      2006 CCSP report:
                      (4) Comparing trend differences between the surface and the troposphere exposes potentially important discrepancies between model results
                      and observations in the tropics.

                      • In the tropics, most observational data sets show more warming at the surface than in the troposphere, while almost all model nsimulations have larger warming aloft than at the surface. Amplification of Surface Warming in the Tropical Troposphere

                      (5) Amplification means that temperatures show larger changes aloft than at the surface. In the tropics, on monthly and inter-annual time scales, both models and observations show amplification of temperature variability in the troposphere relative to the surface. This amplification is of similar magnitude in models and observations. For multi-decadal trends, models show the same amplification that is seen on shorter time scales. The majority of the most recent observed data sets, however, do not show this amplification.
                      Its seems to be its about the quality of the measurements, they simply are struggling to detect patterns, as in if the temp change really exists, it may still go undetected or due to difficulties encountered, the level of uncertainty can result in a produced trend far from the real one. If we understand the levels of uncertaintly in the real observations, we are in a better position to say that the real observations may not always be predicting as the models state but the margin of error is such that what is really happening may fit the models predictions, in a sense that past data collected in the field may not be reliable. Potentially????
                      I have been following this particular issue closely for years because, for the argument of attribution, it is the only one that matters. I understand there may be issues with observational datasets, just as there are with the surface record. However, unlike the surface records (GISS, NCDC, HadCrut), the satellite and radiosonde sets are independent. In order for me to believe that the models are in fact correct I would have to believe that all these independent datasets are flawed in the same direction.

                      Furthermore, I would have to dismiss other evidence that suggests these satellite and radiosonde sets are indeed correct. For instance, the fact that the stratosphere has been warming (not cooling as it should be due to GHG...see above refs) for the last 15-25 years...The fact that we have seen less than 40% of the warming that would be expected from GHG (thanks to that hot troposphere) over the last 150 years...the fact that there is "missing heat" in the system they cannot explain...the fact that, according to the NOAA, all the "warmest decade ever" years were due to ENSO and the trend after removing it was actually 0.00c.....all of things disagree with the models and make sense if the troposphere has not warmed as expected. In order for me to believe the models anyway, I have to ignore all of this.

                      Consider below and subsequent references (Thore et al., 2010), truthfully I have not verified them myself

                      Multiple lines of evidence suggest that many radiosonde datasets suffer from a bias toward excessive stratospheric cooling and insufficient tropospheric warming59,114,120,165,166,169 and that this bias is largest in the tropics,119,123 where the separation between the models and some of the radiosonde observations was largest.
                      Did you read my last post? Did you read the part about the stratosphere warming and the 4 references that report this?

                      If "many radiosondes" suffer from a bias toward excessive stratospheric cooling then that means they are in even more disagreement with models than current observation suggests. This argument does not lend validity to the models...it does the opposite in fact.

                      There's another problem with this argument. Even in their own paper the vast majority of observations are lower than the model projections...how do they know which ones are correct? How can they determine there is insufficient warming in most observations? Compared to what???? The outlier?
                      Think about it.

                      A full measure of both observational uncertainty and model uncertainty must be taken into consideration when assessing whether there is agreement or disagreement between theory (as represented by models) and reality (as represented by observations).
                      But a full measure of uncertainty is NOT taken into account. They only blame the observations that don't tell them what they want to hear. Since the question is, "Is the troposphere warming faster than the surface?" why is it there is no analysis of the surface temperature record here??? Why are we only examining why the independent records of the tropos temp must be too low and not even considering the possibility that the inbred surface temp records are perhaps too high? It's called confirmation bias. That's why.
                      Last edited by Wooglin; 23 Mar 11,, 17:06.

                      Comment


                      • Hide the Decline – the Other Deletion

                        http://climateaudit.org/2011/03/21/h...ther-deletion/

                        Steve McIntyre
                        Mar 21, 2011
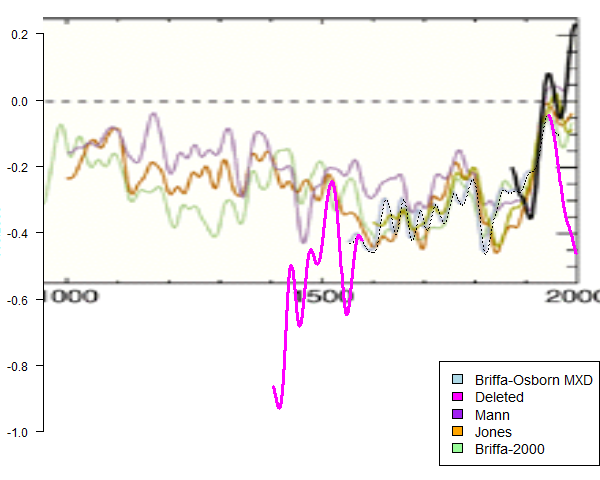
                        I recently re-visited an article in Science (Briffa and Osborn 1999), that, together with Jones et al 1999 (Rev Geophys), were the first bites of the poison apple of hide-the-decline. I observed that key conclusions in Briffa and Osborn 1999 depended on the rhetorical effect of deleting the decline from their spaghetti graph.

                        I’ve been looking at the subsequent development of this graphic and, in the process, noticed another curious feature of the figure in Briffa and Osborn 1999 – shown below.

                        As noted previously, Briffa data was deleted after 1960. (Smoothing was done after the deletion further accentuating the impact of the deletion of post-1960 data.)

                        In addition, and this point has not been previously discussed, Briffa and Osborn did not show data prior to 1550 for the Briffa MXD reconstruction. I’d previously noticed that an archive for Jones et al 1998 (surprisingly) contained a Briffa version that is linearly related to the Science graphic – the match is shown as a dotted line. (The basis of the linear relationship is not reported and not known to me at present, but can nonetheless be used empirically to show the extensions.)

                        In the graphic below, I’ve shown (in magenta) not just the hide-the-decline extension, but the deleted data prior to 1550. Take a look. (Update note- see yesterday’s post for provenance.)

                        Figure 1. From Briffa and Osborn (Science 1999), also with deleted MXD data shown in magenta.

                        Obviously, the deletion of the pre-1550 portion of the Briffa reconstruction version also makes a large contribution to the rhetorical impression of coherence between reconstructions. Ironically, Briffa and Osborn observe in their running text:

                        An uninformed reader would be forgiven for interpreting the similarity between the 1000-year temperature curve of Mann et al. and a variety of others also representing either temperature change over the NH as a whole or a large part of it (see the figure) as strong corroboration of their general validity, and, to some extent, this may well be so.
                        Needless to say, one of the reasons for the reader being “uninformed” is the deletion of adverse data (both before 1550 and after 1960) to give the impression of “corroboration” of the “general validity” of the reconstructions. Note that smoothing after deletion enhances the impact of the deletion – look at the strong divergence pre-1550 as well as post 1960.

                        The provenance of the Briffa reconstruction was tersely described only as follows ( in the caption): “NH tree-ring densities [1550-1960, from (3 - Briffa et al 1998(Nature); Briffa et al 1998 (Proc Roy Soc London)), processed to retain low-frequency signals]“. Appendix A of Briffa et al 2001 contains some useful further information, showing that this version arose from a composite obtained from averaging MXD chronologies in the large Schweingruber network (scaled over 1700-1994, then opportunistically calibrated over 1880-1960):

                        In Figure 4, we show different temperature reconstructions of the NH (all land area temperatures north of 20N), each based on a different way of using MXD predictor data. One curve was produced by performing the age-banding procedure on all chronologies in the data set and by using an unweighted mean of all banded series from all locations. This is similar to the curve from 1650-1960 [sic - actually 1550-1960] presented by Briffa and Osborn [1999] (although we have since made very minor modifications to the age-banding procedure and the input data set.) All other curves in Figure 4 were obtained by prior averaging of the age-banded density series into the nine subregions (as defined by Figure 1.)
                        The next figure shows the Briffa et al 2001 (JGR) spaghetti graph – showing the Briffa 2001 version in limegreen (together with the decline, expurgated in the original figure) and the Briffa-Osborn 1999 version in magenta (including both pre-1550 and post-1960 data):


                        Figure 2. From Briffa et al 2001 (JGR) Plate 3, also showing the pre-deletion data used in Briffa-Osborn 1999 (magenta). The Briffa 2001 version ends in 1960 and has been extended using data from Climategate emails (showing the decline).

                        The changes from the 1999 Briffa version to the 2001 Briffa version are instructive for several reasons.

                        Briffa et al 2001 uses virtually the same population of sites as Briffa and Osborn 1999. The B2001 population was 387 sites, while the Briffa et al 1998 (Nature 393) population (cited in BO99) was 383 sites – immaterially different. The Briffa et al 2001 site count was 19 sites in 1550, 8 in 1500 and only 2 in 1402, but there were enough for Briffa to report a reconstruction. (Readers should bear in mind that the Jones reconstruction, for example, was based on only 3 proxies in the 11th century, one of which was a Briffa tree ring site with only 3-4 cores, well under standard requirements.)

                        So why were pre-1550 values shown in Briffa et al 2001 and not in Briffa and Osborn 1999? The only reason that I can deduce is that the Briffa 2001 reconstruction had a rhetorical similarity to the Mann and Jones reconstructions in the 1400-1550 period – and therefore was shown, while the Briffa and Osborn 1999 version showed a major discrepancy – and was therefore not shown.

                        How did Briffa get from the 1999 reconstruction version (magenta) to the 2001 version (limegreen)?

                        This is an interesting exercise that I’ll describe in more detail on another occasion. But I can’t resist a quick preview. The Briffa-Osborn 1999 version was based on averages of all available sites – a sensible enough procedure. Changes in the Briffa 2001 methodology include the calculation of regional averages followed by stepwise principal components. (The methodological description in Briffa et al 2001 is very sketchy and, unfortunately, the Climategate computer dossier didn’t include Briffa’s programs.)

                        The effect of using principal components on regional averages is to change the weights for individual sites, including the possibility of negative weights i.e. flipping the regional MXD series. In particular, the closing uptick in the Briffa 2001 reconstruction may well depend on the flipping of data – a point that I’ll try to examine in the future.
                        Last edited by Wooglin; 25 Mar 11,, 20:38.

                        Comment


                        • Global warming: Critics' review unexpectedly supports scientific consensus on climate change - latimes.com
                          Anyone who has been citing Mueller as a source to dispute AGW needs to reconsider He is now saying the evidence points to warming
                          Where free unions and collective bargaining are forbidden, freedom is lost.”
                          ~Ronald Reagan

                          Comment


                          • Originally posted by Roosveltrepub View Post
                            Global warming: Critics' review unexpectedly supports scientific consensus on climate change - latimes.com
                            Anyone who has been citing Mueller as a source to dispute AGW needs to reconsider He is now saying the evidence points to warming
                            Science is not about consensus. It either is, or it isn't.
                            "Only Nixon can go to China." -- Old Vulcan proverb.

                            Comment


                            • Originally posted by gunnut View Post
                              Science is not about consensus. It either is, or it isn't.
                              Based upon fact.

                              Comment


                              • Originally posted by gunnut View Post
                                Science is not about consensus. It either is, or it isn't.
                                Yes, and I pointed out one of the superstars of the denialist faith looked at the facts and and he came out with similar numbers as those you claim lie.
                                Where free unions and collective bargaining are forbidden, freedom is lost.”
                                ~Ronald Reagan

                                Comment

                                Working...
                                X